: circle maps, bub")
In my 3rd-grade classroom, my students use thinking maps — which are not graphic organizers! — to represent their ideas. Each type of thinking map connects a basic cognitive skill with a visual representation.
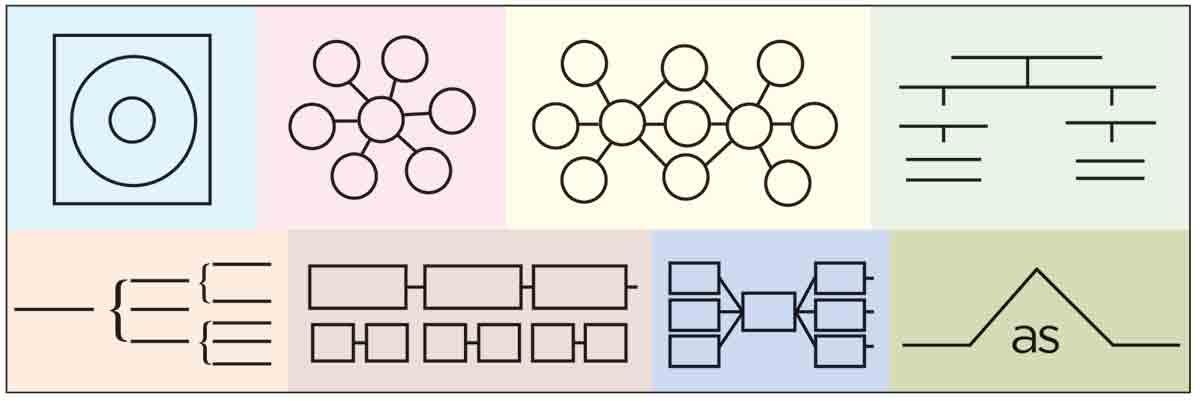
There are eight types of thinking maps:
- Circle map: for defining or brainstorming
- Flow map: for sequencing
- Bubble map: for describing
- Double bubble map: for comparing and contrasting
- Tree map: for classifying
- Multi-flow map: for cause and effect
- Brace map: for part-whole relationships
- Bridge map: for seeing analogies
I typically start the year with the circle map. I put a word or idea in the middle of the circle and ask students to come up with adjectives to describe it. On the first day of school, I asked students to write their names in the middle of the circle and adjectives they would use to describe themselves in the outer circle. They used the circle map to facilitate a discussion with a partner about themselves.
I then move on to flow maps for sequencing, which work well with both fiction and nonfiction texts. Students create boxes of key events in order, followed by details about each key event. Flow maps can be used in science for the order of the scientific method or experiments. In math, flow maps can be used to explain how to solve a word problem in steps.
Following that, I model the bubble map, a more complex version of the circle map. In reading, we put a character’s traits into the center circle and students choose supporting details for the outer circles.
This leads us into the double bubble map for comparing and contrasting. My students have recently used this to compare and contrast the American version of “Cinderella” with the Chinese version. We’ve also used this in science to compare and contrast animals and in math to show the relationship between multiplication and division. This is a great map to use to plan for essays.
A tree map depicts one idea that “branches” into underlying ideas. My class has used the tree map for representing the main idea and supporting details of a text.
On a multi-flow map, several boxes lead into one box, which then leads to several other boxes. We’ve used the multi-flow map to show cause-and-effect relationships between events in a story. We’ve also used it to analyze key events in history.
Brace maps show how one idea is composed of several others. In science, I use the brace map to explain the body parts of an animal.
Lastly, students can use bridge maps to connect related ideas. We use bridge maps to show relationships between words, like synonyms and antonyms. English language learners can also use bridge maps to show the relationship between words in different languages.
My students use all eight maps across all the different content areas. When you first begin to use these maps, you will need to tell students which map to use; as they become more comfortable with the concept, they can choose the kind of map that works for the particular task.
After they complete a map, students are ready to synthesize the information in it. These thinking maps help students think critically and prepare them for writing.