Excluding the Neediest Students is Key to Top Charter Schools’ Success

UFT President Michael Mulgrew
The following op-ed by UFT President Michael Mulgrew appeared in City and State online on Dec. 11
New York City’s charter schools have a history of shutting the schoolhouse door to many of our neediest children, such as English language learners, special education students or those from the poorest families. Charters as a group enroll a significantly smaller percentage of such pupils than the public schools.
Charter proponents have traditionally ignored or minimized the role of this strategy in the academic results of charters. But a new analysis of individual charter schools clearly shows that the schools most successful at excluding these students are the charters with the highest test scores.
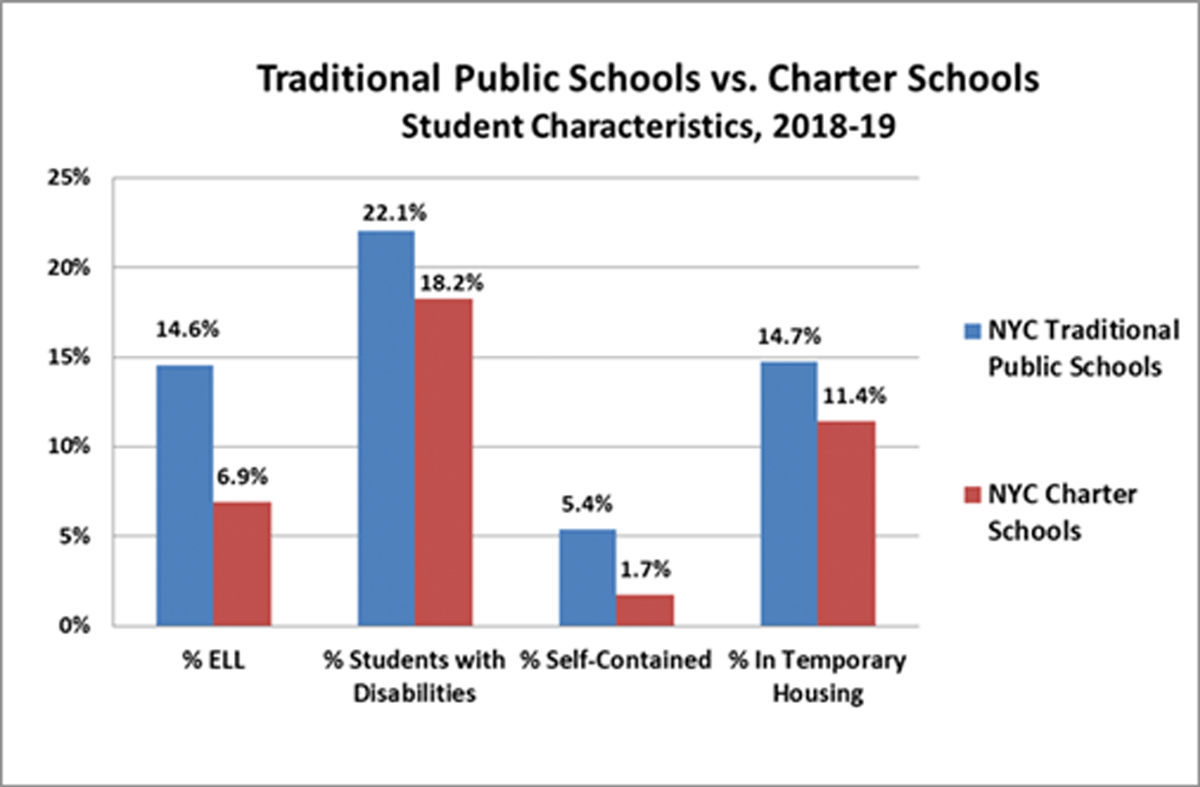
For the 2018-19 school year, the latest for which data is available, charters as a group enrolled half the citywide average of ELLs, significantly fewer students with disabilities – particularly those with the most challenging needs – and fewer students from the poorest families.
Chart 1: New York City Charters vs. New York City Traditional Public Schools

Source: 2018-19 School Quality Report, Elementary, K-8, Middle & High Schools
But the charter average turns out to be only half the story. Within the charter sector, the varying degree to which such students are excluded proves to be an important factor in individual charter school success.
Using the most recent state English language exam as a starting point, we broke down the New York City charter sector into four groups: Tier 1 was the most successful, with a pass rate of 67% or higher; Tier 2 was charters with pass rates of 55% to 67%; Tier 3, 44% to 55%.
Tier 4 was made up of the nearly 50 charters that failed to reach even the citywide ELA average (raising the question that if charters are such a magical solution to school system woes, why do fully one-quarter of them lag behind the citywide average?)
As the table shows, Tier 1 charters have about half as many English Language Learners as the charters in Tier 4, only two-thirds the number of students with disabilities and significantly fewer students in poverty.
Chart 2: Charter Reading Scores and Student Demographics
| % ELA Proficiency | School Count | % English Language Learners | % Students with Disabilities | % Poverty | |
|---|---|---|---|---|---|
| Tier 1 | 67.2% - 100.0% | 48 | 5.7% | 13.3% | 74.3% |
| Tier 2 | 55.1% - 67.1% | 48 | 7.0% | 13.3% | 74.3% |
| Tier 3 | 44.0% - 55.0% | 48 | 6.6% | 17.5% | 80.7% |
| Tier 4 | 15.5% - 43.9% | 48 | 9.6% | 22.5% | 83.5% |
Source: NYC DOE 2018-19 Demographic Snapshot and Test Scores
In virtually every one of these categories, the numbers tell aclear story: the smaller the percentage of challenged students, the higher the overall test scores of charter schools.
Manipulating admission and retention
How do charters – particularly the ones most successful on standardized tests – find ways to minimize the number of pupils less likely to contribute to that success? They start out with the most committed families, then find ways to get low performers out.
New York charter schools boast that they enroll their incoming students on a randomized basis. But the reality is that the students in the pool from which they draw have parents with a knowledge of the system and the motivation to enter their children in the charter lottery – a particularly high bar for immigrant parents and those whose first language is not English.
This phenomenon is not unique to charters, but has been found in national studies to be part of the apparent success of many parochial and private schools.
Robert Pondiscio, an author with many sympathies for the charter movement, wrote most recently in his book on Success Academy (“How the Other Half Learns”) that the idea that essentially the same kinds of students attend both public schools and charters, while “deeply satisfying to charter school advocates… is also misleading and even false” because of the critical nature of parental motivation.
Shrinking the student body
The next step in the charter success strategy is to find ways to ease out those less likely to be successful.
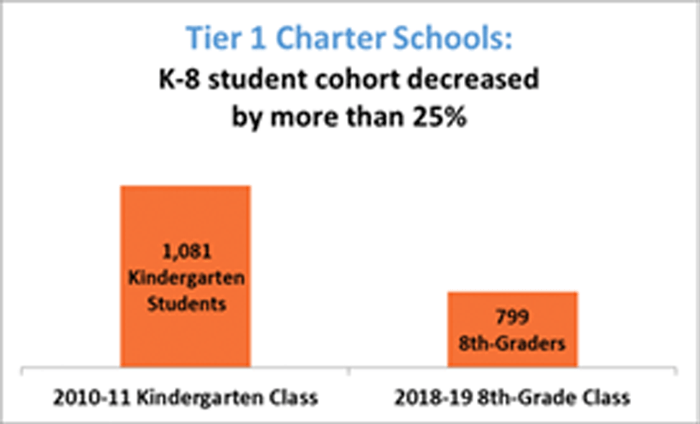
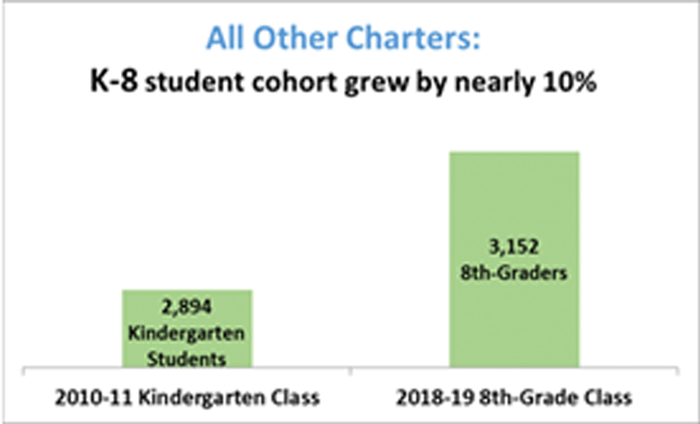
Our analysis of all K-8th-grade charters from the 2010-11 to 2018-19 school years shows that Tier 1 – the most academically successful group – had a loss of 26% of the students who started in the cohort in 2010. Meanwhile, the 2010 cohort in the less successful charters actually gained students.
Chart 3: Impact of Student Attrition


Given the data, it is hard to avoid the obvious conclusion that Tier 1 charters are consciously shedding academically struggling students – and reaping the results in terms of higher test scores. Only actual student academic records would refute such a conclusion, and it is unlikely that the charters will see it as in their interest to provide those records.
Suspending their way to success
Given the high rate of student attrition, what role did suspensions or other disciplinary actions play in families’ decisions to leave? Repeated suspensions are a key tactic in persuading students and their families who do not fit in to find other schools (generally in the public system).
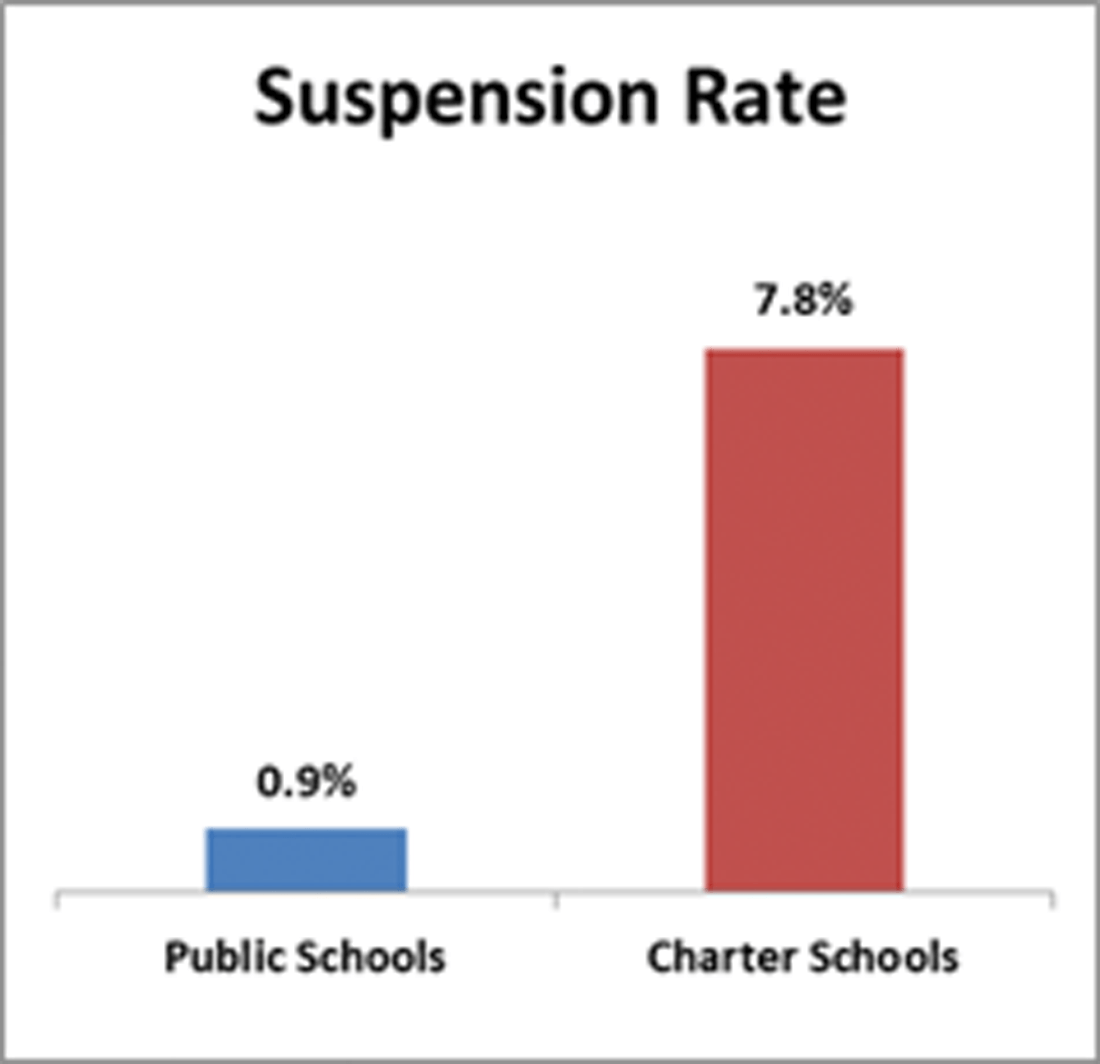
The charters certainly aren’t going to tell us. But state data shows that charters as a group suspended students far more frequently than public schools did, and that Tier 1 charters – with a suspension rate of more than 8% – led the way.
Chart 4: Suspensions: NYC Public Schools vs. NYC Charters

Student Suspension rate is determined by dividing the number of students who were suspended from school (not including in-school suspensions) for one full day or longer anytime during the school year by the Basic Educational Data System (BEDS) day enrollments for that school year. A student is counted only once, regardless of whether the student was suspended one or more times during the school year. Suspension data are lagged a year because data for the reporting year are reported in October following the close of that reporting year. Source: 2016 State Data, data.nysed.gov
The burden of charter costs
The charter sector consistently claims superior student results, while denying the effects of its exclusionary policies, particularly in the highest-scoring charter schools. Those misleading assertions have helped to drive the sector’s expansion to the point that an estimated $2.1 billion in city Department of Education funds are now diverted every year to charter operations.
This number is scheduled to grow as current charters – with no further regulatory or legislative action – expand their grades in future years to add as many as 50,000 more students.
Approximately 121 charter schools are now co-located in public school buildings, too often involving the loss of libraries, labs, music rooms and other facilities for the public school students involved. According to an estimate by the organization Class Size Matters, from 2014 to 2019, the total amount of public funds spent for co-located space and for charter school leases and lease assistance reached $377.5 million. www.classsizematters.org
Yet these enormous public investments are going to many schools that exclude the neediest students – and rely on such exclusion to fuel their claims of success.